
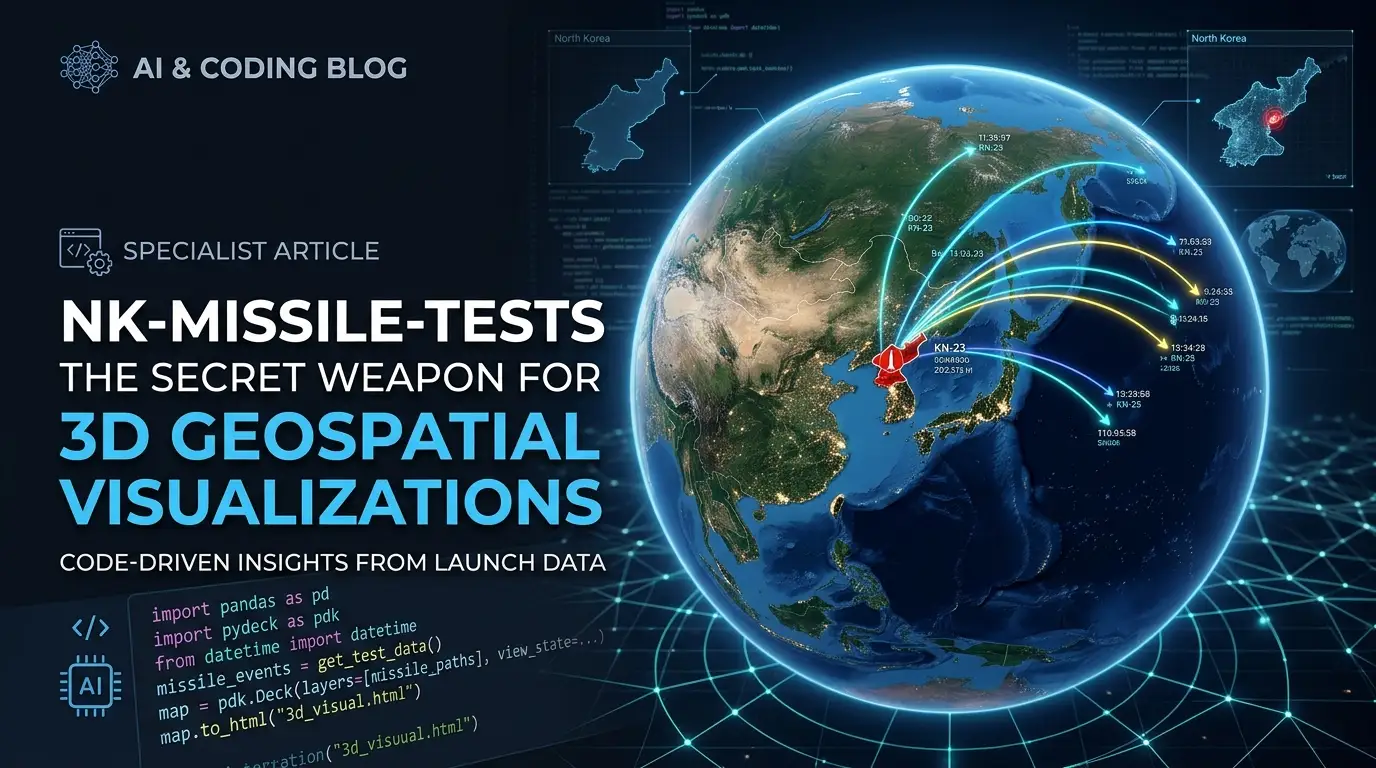
nk-missile-tests: The Secret Weapon for 3D Geospatial Visualizations
What if I told you that one of the most impressive interactive 3D globe visualizations on the web was hiding in plain sight—and that you could steal its architecture for your own projects?
Here's the brutal truth: most developers are still building flat, boring 2D maps when their users desperately crave immersive, explorable 3D experiences. They're wrestling with bloated mapping libraries, fighting WebGL performance issues, and drowning in complexity that kills their timelines. Meanwhile, a small but growing group of developers has discovered a different path—one that leads to buttery-smooth globe rotations, real-time satellite tracking, and data storytelling that actually captivates audiences.
That path starts with nk-missile-tests.
Created by Akihiko Kusanagi, this deceptively named repository isn't just a geopolitical data project. It's a masterclass in browser-based 3D visualization that you can dissect, learn from, and repurpose for virtually any geospatial application. Missile trajectories? Satellite orbits? Climate data? Population flows? The underlying engine handles them all with the same effortless grace.
In this deep dive, I'll expose exactly what makes nk-missile-tests tick, why developers are quietly forking it for their own projects, and how you can harness its power—whether you're building the next big data journalism piece or a commercial logistics dashboard. The techniques inside this repository could shave weeks off your development cycle. Ignore them at your peril.
What is nk-missile-tests?
nk-missile-tests is an interactive 3D visualization of every North Korean missile test conducted from 1984 to 2026, complete with real-time satellite orbit tracking. But reducing it to its subject matter misses the point entirely.
At its core, this is a production-grade WebGL application built on principles borrowed from Google's legendary Data Arts Team. Akihiko Kusanagi, the repository's creator, took inspiration from the Arms Globe Visualization project and elevated it with modern techniques, cleaner data pipelines, and satellite mechanics that would make a space engineer nod in approval.
The project sits at a fascinating intersection: data journalism, aerospace engineering, and cutting-edge web graphics. It transforms dry spreadsheet entries—launch dates, missile types, success rates, trajectories—into an explorable narrative that users can manipulate with intuitive gestures. Rotate the globe with a drag. Zoom into launch sites with a scroll. Filter decades of history with a click. Tilt the perspective to see ballistic arcs in their full three-dimensional glory.
What makes nk-missile-tests genuinely trend-worthy in developer circles is its architectural transparency. Unlike proprietary visualization platforms that hide their magic behind SaaS paywalls, every technique here is exposed in clean, forkable JavaScript↗ Bright Coding Blog. Want to understand how bearing calculations translate to landing coordinates? It's in the code. Curious how CelesTrak satellite data gets transformed into smoothly orbiting dots? The transformation pipeline is right there. This isn't a black box—it's an open textbook for 3D geospatial development.
The repository has gained particular traction among:
- Data journalists seeking to elevate their interactive storytelling
- Aerospace developers prototyping mission visualization tools
- GIS specialists frustrated with the limitations of traditional mapping libraries
- Creative technologists building immersive museum installations
- Full-stack engineers who need to impress stakeholders with demo-ready visuals
Key Features That Set It Apart
Let's dissect what makes nk-missile-tests technically remarkable—and why you should care about each capability for your own projects.
True 3D Globe Rendering with WebGL The visualization doesn't fake depth with pre-rendered sprites or CSS tricks. It uses proper WebGL sphere geometry with custom shaders for atmospheric glow, night-side illumination, and responsive terrain detail. The globe feels physical—it has weight, momentum, and parallax that flat map projections simply cannot replicate.
Dual Data Layer Architecture Most visualization projects handle one data type adequately and fail at everything else. nk-missile-tests elegantly manages two fundamentally different datasets: discrete historical events (missile tests with fixed timestamps and trajectories) and continuous orbital mechanics (satellites whose positions must be calculated in real-time using Keplerian elements). This dual-mode handling is directly applicable to logistics dashboards tracking both completed shipments and in-transit vehicles.
Calculated Trajectory Reconstruction Here's where the aerospace engineering gets interesting. The raw CNS database doesn't include exact landing coordinates—it only records launch facilities and distances traveled. Kusanagi's team solved this by integrating bearing data from Japan's Ministry of Defense, then performing geodetic calculations to reconstruct plausible impact zones. For developers, this demonstrates how to enrich sparse datasets with authoritative secondary sources—a pattern applicable to everything from epidemiology to financial modeling.
Temporal Navigation System The timeline bar isn't decorative chrome—it's a data-driven scrubber that filters the entire scene graph in real-time. Select 2006, and only that year's tests illuminate. Drag across decades, and watch North Korea's missile program evolve from short-range Scud derivatives to intercontinental threats. This temporal filtering architecture transfers directly to any time-series visualization.
Multi-Axis Filtering with Instant Feedback Users can simultaneously filter by outcome (success/failure/unknown), missile type, and date range—with all visual elements updating without page reloads. The state management pattern here, combining URL hash persistence with in-memory filtering, provides a blueprint for complex dashboard interfaces.
Responsive Input Handling
Desktop mouse, trackpad gestures, touch screens, keyboard modifiers—nk-missile-tests handles them all through a unified input abstraction layer. The Shift + drag tilt mechanic, in particular, shows sophisticated UX thinking that most visualization projects neglect entirely.
Use Cases: Where This Architecture Shines
The nk-missile-tests codebase isn't a one-trick pony. Its architectural patterns solve real problems across multiple domains.
Aerospace Mission Control Dashboards
Space companies and satellite operators need to visualize orbital constellations, ground track predictions, and potential conjunction risks. The CelesTrak integration and orb.js usage in nk-missile-tests provides a complete reference implementation. Replace North Korean satellites with your own fleet, swap missile trajectories for launch vehicle ascent profiles, and you have a mission control prototype.
Supply Chain & Logistics Visualization Global shipping companies struggle to communicate the complexity of their networks to stakeholders. The same globe-with-trajectories pattern works beautifully for container ship routes, aircraft flight paths, or submarine cable systems. The filtering mechanisms let users drill from global overview to specific corridors instantly.
Epidemiological Spread Modeling Remember when everyone needed to visualize how COVID-19 spread across the globe? The temporal scrubber and arc-drawing capabilities in nk-missile-tests map perfectly to disease transmission patterns. Johns Hopkins-style dashboards gain dramatic impact when users can rotate to see outbreak corridors from multiple angles.
Climate & Environmental Data Storytelling Ocean current visualizations, migration pattern tracking, wildfire spread over terrain—any environmental dataset with geospatial and temporal dimensions benefits from this presentation mode. The 3D perspective reveals spatial relationships that Mercator projections distort beyond recognition.
Defense & Intelligence Analysis The original use case, obviously, remains relevant. But the pattern extends to border monitoring, maritime domain awareness, and infrastructure vulnerability assessment. The key insight: threat landscapes are inherently three-dimensional, and flat maps systematically underrepresent their complexity.
Museum & Exhibition Interactive Installations Physical spaces demand visceral, intuitive interfaces. The gesture controls in nk-missile-tests—drag to rotate, pinch to zoom, tilt for perspective—translate directly to touchscreen kiosks and large-format displays. No instruction manual required.
Step-by-Step Installation & Setup Guide
Ready to explore the codebase yourself? Here's how to get nk-missile-tests running locally.
Prerequisites You'll need a modern Node.js environment (v16+ recommended) and a code editor. The project is fundamentally client-side, so no database setup is required.
Clone the Repository
# Clone the repository to your local machine
git clone https://github.com/nagix/nk-missile-tests.git

# Navigate into the project directory
cd nk-missile-tests
Examine the Project Structure
# List the contents to understand the architecture
ls -la

# Key directories you'll find:
# - images/          # UI assets and screenshots
# - js/              # Core JavaScript modules
# - data/            # JSON datasets (missile tests, satellite TLEs)
# - index.html       # Main application entry point
Serve Locally
Because nk-missile-tests uses WebGL and loads data files via XHR, you'll need a local server rather than opening index.html directly:
# Using Python↗ Bright Coding Blog 3's built-in server
python3 -m http.server 8000

# Or using Node's npx serve
npx serve .

# Or using VS Code's Live Server extension
# Right-click index.html → "Open with Live Server"
Access the Application
Navigate to http://localhost:8000 in your browser. For WebGL debugging, Chrome's DevTools provide excellent shader inspection and performance profiling.
Configuration Points The repository doesn't use a traditional config file, but key parameters are exposed in the JavaScript modules:
- Globe texture resolution: Modify in the Three.js scene initialization
- Animation speeds: Adjust in the timeline controller
- Data refresh intervals: For satellite positions, controlled in the
orb.jsintegration layer - Color schemes: Test outcome colors and trajectory gradients are CSS-customizable
Production Deployment The project is static-file friendly. Deploy to GitHub Pages, Netlify, Vercel, or any CDN directly from the repository root. The live demo itself runs on GitHub Pages without server-side processing.
REAL Code Examples from the Repository
Let's examine actual patterns from the nk-missile-tests codebase and understand what makes them tick.
Example 1: Satellite Position Calculation with orb.js
The project integrates orb.js to convert Two-Line Element sets (TLEs) into live orbital positions. Here's the conceptual pattern:
// Initialize orb.js with satellite TLE data from CelesTrak
// TLE format: two lines of orbital parameters used by NORAD
const tleLine1 = '1 41332U 16003A   24101.50000000  .00000000  00000-0  00000-0 0  9999';
const tleLine2 = '2 41332  97.4000  120.0000 0009000  90.0000 270.0000 15.50000000    09';

// Create satellite record using orb.js parser
// This encapsulates all SGP4 propagation mathematics
const satellite = new orb.Satellite(tleLine1, tleLine2);

// Calculate position for current time
// Returns ECI (Earth-Centered Inertial) coordinates
const position = satellite.position(new Date());

// Convert ECI to geographic coordinates for globe placement
// This rotation accounts for Earth's orientation at the epoch
const geographic = orb.Coordinate.eciToGeographic(position, new Date());

// Result: { latitude, longitude, altitude } for 3D globe positioning
console.log(geographic.latitude, geographic.longitude, geographic.altitude);
This pattern is directly reusable for any satellite tracking application. The orb.js library handles the complex SGP4 orbital propagation model, letting you focus on visualization rather than celestial mechanics.
Example 2: Interactive Input Handling
The gesture system unifies multiple input devices into consistent camera controls:
// Unified input handler abstracts mouse, touch, and keyboard
class GlobeInputController {
  constructor(camera, domElement) {
    this.camera = camera;
    this.domElement = domElement;
    this.isDragging = false;
    this.isTilting = false;  // Shift key modifier state

    // Bind event listeners for all input modalities
    domElement.addEventListener('mousedown', this.onPointerDown.bind(this));
    domElement.addEventListener('touchstart', this.onPointerDown.bind(this), { passive: false });
    domElement.addEventListener('wheel', this.onWheel.bind(this));

    // Pinch detection for mobile zoom
    this.lastTouchDistance = null;
  }

  onPointerDown(event) {
    this.isDragging = true;
    // Shift key enables tilt mode instead of rotation
    this.isTilting = event.shiftKey || (event.touches && event.touches.length === 3);
    this.lastPosition = this.getPointerPosition(event);
  }

  onPointerMove(event) {
    if (!this.isDragging) return;

    const currentPosition = this.getPointerPosition(event);
    const deltaX = currentPosition.x - this.lastPosition.x;
    const deltaY = currentPosition.y - this.lastPosition.y;

    if (this.isTilting) {
      // Three-finger swipe or Shift+drag tilts the camera up/down
      // This reveals trajectory arcs from side angles
      this.camera.tilt(deltaY * 0.01);
    } else {
      // Standard drag rotates globe around polar axis
      this.camera.rotate(deltaX * 0.005, deltaY * 0.005);
    }

    this.lastPosition = currentPosition;
  }

  onWheel(event) {
    // Normalize wheel delta across browsers
    const delta = event.deltaY > 0 ? 1.1 : 0.9;
    this.camera.zoom(delta);
  }
}
Notice how three-finger touch replaces Shift+mouse for tilt on mobile—a thoughtful accessibility pattern that respects platform conventions.
Example 3: Trajectory Arc Generation
Missile paths are rendered as 3D quadratic curves, calculated from launch site and reconstructed landing coordinates:
// Generate arc geometry for missile trajectory visualization
function createTrajectoryArc(launchLat, launchLon, landingLat, landingLon, apogeeKm) {
  // Convert geographic coordinates to 3D Cartesian on unit sphere
  const start = latLonToVector3(launchLat, launchLon, 1.0);  // Surface radius
  const end = latLonToVector3(landingLat, landingLon, 1.0);

  // Calculate midpoint elevated by apogee altitude
  // This creates the characteristic ballistic arc shape
  const mid = new THREE.Vector3().addVectors(start, end).multiplyScalar(0.5);
  const earthRadiusKm = 6371;
  const altitudeScale = 1 + (apogeeKm / earthRadiusKm);
  mid.normalize().multiplyScalar(altitudeScale);

  // Create smooth curve through three control points
  const curve = new THREE.QuadraticBezierCurve3(start, mid, end);

  // Generate geometry with sufficient segments for smooth rendering
  const points = curve.getPoints(64);
  const geometry = new THREE.BufferGeometry().setFromPoints(points);

  // Color gradient from launch (green) to landing (red)
  const colors = [];
  for (let i = 0; i < points.length; i++) {
    const t = i / (points.length - 1);
    const color = new THREE.Color().lerpColors(
      new THREE.Color(0x00ff00),  // Launch: green
      new THREE.Color(0xff0000),  // Landing: red
      t
    );
    colors.push(color.r, color.g, color.b);
  }
  geometry.setAttribute('color', new THREE.Float32BufferAttribute(colors, 3));

  return geometry;
}
The color gradient encoding is subtle but powerful—users intuitively understand directionality without explicit legends.
Example 4: Temporal Filtering State Machine
The timeline scrubber drives a reactive filtering system:
// State management for temporal and categorical filters
class FilterState {
  constructor() {
    this.yearRange = [1984, 2026];
    this.selectedYear = null;  // null means "all years"
    this.outcomes = new Set(['SUCCESS', 'FAILURE', 'UNKNOWN']);
    this.missileTypes = new Set();  // Empty means "all types"
  }

  // Update visibility of all test markers based on current filters
  applyFilters(testMarkers) {
    testMarkers.forEach(marker => {
      const test = marker.userData;

      // Temporal filter: exact year match or range inclusion
      const yearMatch = this.selectedYear === null ||
                        test.date.getFullYear() === this.selectedYear;

      // Outcome filter: must be in active set
      const outcomeMatch = this.outcomes.has(test.outcome);

      // Missile type filter: empty set means no restriction
      const typeMatch = this.missileTypes.size === 0 ||
                        this.missileTypes.has(test.missileName);

      // Composite visibility determination
      marker.visible = yearMatch && outcomeMatch && typeMatch;

      // Animate transition for visual polish
      if (marker.visible) {
        this.animateMarkerIn(marker);
      } else {
        this.animateMarkerOut(marker);
      }
    });

    // Update histogram to reflect filtered distribution
    this.updateHistogram(testMarkers);
  }
}
This composite filtering pattern scales to arbitrarily complex dashboard requirements.
Advanced Usage & Best Practices
Having dissected the codebase, here are pro strategies for extending nk-missile-tests or adapting its patterns.
Performance Optimization for Large Datasets
The current implementation renders all trajectories simultaneously. For datasets exceeding 1,000 paths, implement level-of-detail culling: render simplified curves at distance, full geometry on zoom. Use Three.js BufferGeometry instancing for repeated marker geometries.
Custom Data Ingestion Pipeline The repository's data format is straightforward JSON. For your own projects, build a preprocessing pipeline that:
- Validates coordinates against known geographic boundaries
- Pre-calculates trajectory arcs server-side to reduce client computation
- Generates spatial indexes (R-trees or geohashes) for rapid filtering
Responsive Design Considerations The current UI assumes desktop-primary usage. For mobile-first deployments, consider:
- Collapsing the histogram into a bottom sheet
- Replacing multi-select missile filters with a searchable dropdown
- Adding haptic feedback on gesture completion
Accessibility Enhancements WebGL canvases are notoriously screen-reader hostile. Mitigate with:
- ARIA live regions announcing filter state changes
- Keyboard-only navigation mode (arrow keys for rotation, +/- for zoom)
- High-contrast color scheme option for trajectory arcs
Integration with Modern Frameworks
The vanilla JavaScript architecture is refreshingly dependency-light, but React↗ Bright Coding Blog/Vue/Svelte wrappers can improve state management for complex extensions. Consider porting the FilterState class to your framework's reactivity system.
Comparison with Alternatives
| Feature | nk-missile-tests | CesiumJS | Mapbox GL JS | Google Earth API | D3.js |
|---|---|---|---|---|---|
| Bundle Size | Lightweight (~200KB) | Heavy (~2MB) | Medium (~800KB) | Deprecated | Lightweight (~300KB) |
| 3D Globe | Native WebGL | Native | Plugin only | Native (dead) | 2D projections only |
| Satellite Orbits | Built-in via orb.js | Requires custom plugin | Not supported | Not supported | Manual calculation |
| Open Source | Apache 2.0 | Apache 2.0 | Proprietary | N/A (dead) | BSD |
| Learning Curve | Moderate (readable code) | Steep | Moderate | N/A | Moderate |
| Custom Trajectories | First-class support | Possible with effort | Limited | Limited | Complex path math |
| Mobile Performance | Excellent | Good | Good | N/A | Excellent |
| Data Journalism Fit | Excellent | Good | Good | N/A | Excellent |
Why nk-missile-tests wins for specific use cases:
- Over CesiumJS: When you need satellite mechanics without the aerospace-industry complexity tax. Cesium's power is overkill for most editorial visualizations.
- Over Mapbox: When true 3D perspective matters. Mapbox's globe mode is recent and still maturing; nk-missile-tests has proven stability.
- Over D3: When geographic relationships require spherical rather than planar representation. D3's projections inherently distort; this doesn't.
FAQ
What exactly does nk-missile-tests visualize? It displays all North Korean missile flight tests from 1984-2026 as interactive 3D trajectories on a globe, plus real-time positions of the country's active satellites.
Is this a political statement or neutral data tool? The repository is strictly a data visualization implementation. The underlying CNS database is maintained by nonproliferation researchers; the code itself carries no political framing.
Can I use this for non-military data? Absolutely. The architecture is domain-agnostic. Replace the missile test dataset with shipping routes, migration patterns, or communication networks—the visualization engine handles any geospatial trajectory data.
How accurate are the landing locations? The CNS database provides launch sites and distances; landing coordinates are calculated estimates incorporating bearing data from Japan's Ministry of Defense. They're plausible reconstructions, not verified impact points.
What browsers support this? Any modern browser with WebGL 1.0 support: Chrome, Firefox, Safari, Edge. Internet Explorer is not supported (and shouldn't be used anyway).
How do I update satellite positions in real-time? The implementation fetches current TLE data from CelesTrak. For production deployments, implement a caching proxy to respect rate limits and ensure availability.
Is there a React/Vue/Angular version?
Not officially, but the modular JavaScript structure ports cleanly. The FilterState and GlobeInputController classes encapsulate logic that translates directly to framework-specific state management.
Conclusion
nk-missile-tests is far more than its provocative name suggests. It's a crystallized best practice for browser-based 3D geospatial visualization—a reference implementation that punches dramatically above its weight class.
What Akihiko Kusanagi has built demonstrates something crucial: you don't need massive frameworks or proprietary platforms to create world-class interactive graphics. Clean architecture, thoughtful UX, and disciplined data processing can achieve results that rival teams with exponentially larger resources.
For developers, the invitation is clear. Fork the repository. Dissect the orb.js integration. Study how sparse data gets enriched into compelling visual narratives. Adapt the gesture controls for your own canvas applications. The patterns inside will accelerate your next geospatial project by weeks.
The geopolitical dataset is fascinating in its own right. But the engineering lessons are universal. Whether you're tracking satellites, ships, diseases, or dollars across our spherical world—nk-missile-tests shows you how to make that data feel immediate, explorable, and real.
Explore the live demo. Fork the repository on GitHub. Build something that makes flat maps feel like the relics they are.
The globe is waiting.