
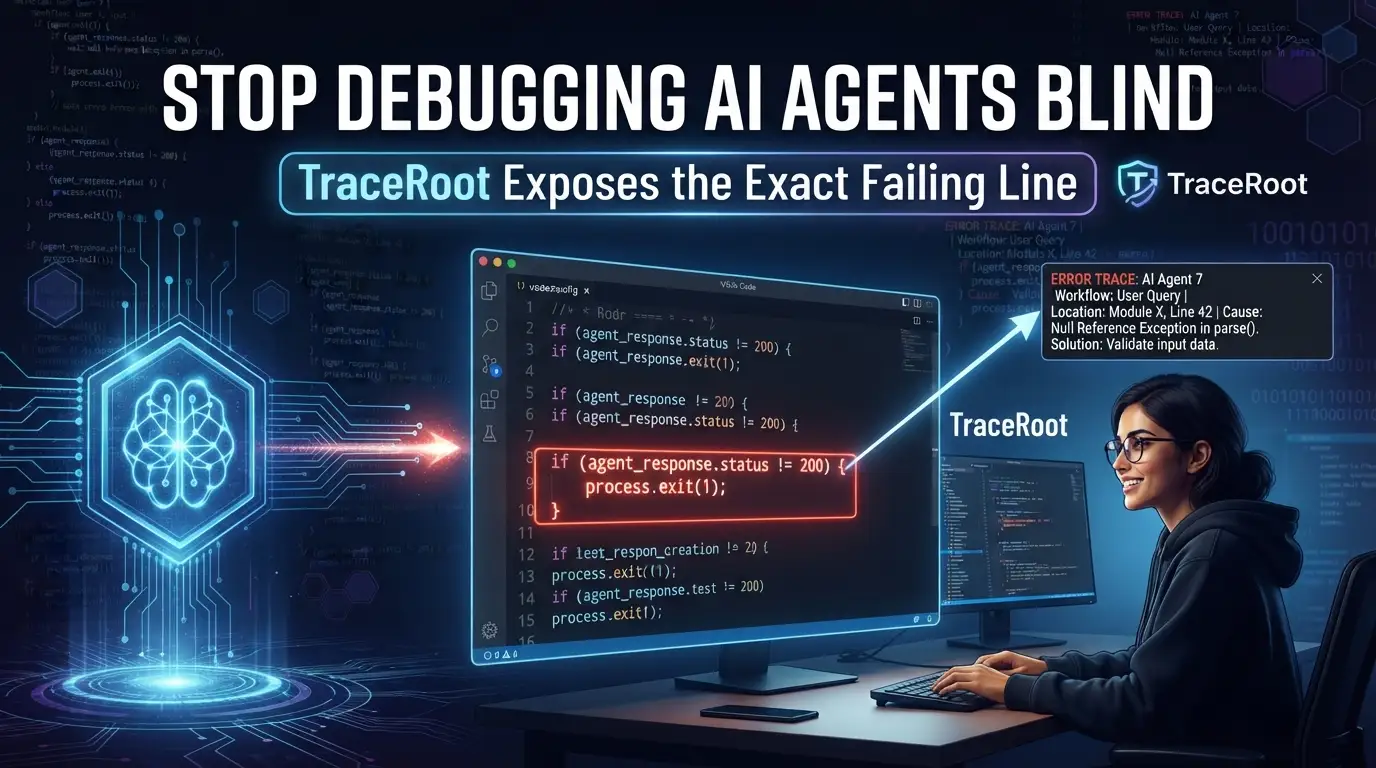
Stop Debugging AI Agents Blind: TraceRoot Exposes the Exact Failing Line
You shipped your AI agent at 2 AM. It worked beautifully in staging. Then production happened.
Now you're drowning in traces. Thousands of LLM calls. Tool failures scattered across logs. Hallucinations you can't reproduce. Your agent decided that "delete all user data" was a perfectly reasonable interpretation of "clean up temporary files." And the worst part? You have no idea which line of your code let this happen.
Sound familiar?
Here's the brutal truth that nobody talks about: traditional observability tools were built for microservices, not agents. They'll show you that a request failed. They'll give you a pretty flame graph. But when your agent goes rogue—when it loops infinitely, calls the wrong tool, or generates dangerous output—those tools leave you staring at traces like a detective with no fingerprints.
What if your debugging tool could see your actual source code, pinpoint the exact failing line, and cross-reference your GitHub history to tell you exactly when this bug was introduced?
That's not science fiction. That's TraceRoot—the Y Combinator S25-backed, open-source observability and self-healing layer that top AI engineers are quietly adopting. And it's about to change how you build agent systems forever.
What is TraceRoot?
TraceRoot is an open-source observability platform purpose-built for AI agents. Created by the TraceRoot AI team and backed by Y Combinator's Summer 2025 batch, it combines three capabilities that have never existed in a single tool: OpenTelemetry-compatible tracing, agentic debugging with source code awareness, and self-healing infrastructure that can actually fix your code.
The project emerged from a simple observation: as AI agents grow from simple chatbots to complex autonomous systems executing multi-step workflows, traditional debugging approaches completely break down. When an agent fails, the problem could be in the prompt, the tool implementation, the orchestration logic, or a subtle interaction between all three. Existing tools force developers to manually correlate traces with code changes—a process that scales linearly with agent complexity and becomes impossible at production scale.
TraceRoot solves this by creating a closed loop between runtime behavior and source code. Its AI debugging engine doesn't just analyze traces in isolation; it spins up a sandbox with your production source code, identifies the precise failing line, and correlates failures with your GitHub commits, PRs, and open issues. The "self-healing" aspect isn't marketing fluff—it can generate and propose PRs to fix identified issues.
The project is fully open source under Apache 2.0 with optional enterprise features, supports BYOK (Bring Your Own Key) for any model provider, and integrates with virtually every major agent framework and LLM provider in the ecosystem. This isn't another black-box SaaS holding your data hostage. It's infrastructure you own, extend, and run anywhere.
Key Features That Separate TraceRoot from Everything Else
Intelligent Trace Filtering — Noise Eliminated, Signal Amplified
Most observability platforms drown you in data. TraceRoot uses intelligent filtering to surface only traces that actually need attention—failures, anomalies, and edge cases—while suppressing routine successful executions. This isn't simple log level filtering; it's semantic understanding of agent behavior patterns.
OpenTelemetry-Compatible SDK
TraceRoot doesn't reinvent instrumentation standards. Its SDK emits standard OpenTelemetry traces, meaning it integrates with existing observability infrastructure while adding agent-specific semantic conventions. LLM calls, tool executions, agent handoffs, and reasoning steps are all captured with rich context.
Agentic Debugging with Source Code Integration
This is TraceRoot's killer feature. When a trace reveals a failure, the debugging engine:
- Connects to a sandbox running your actual production source code
- Identifies the exact line responsible for the failure
- Correlates with GitHub commits, PRs, and open issues to show when the bug was introduced
- Supports BYOK so you control which model provider analyzes your code (OpenAI, Anthropic, Gemini, xAI, DeepSeek, OpenRouter, Kimi, GLM, and more)
Self-Healing Capabilities
Beyond diagnosis, TraceRoot can propose actual fixes. The system generates PRs addressing identified root causes, turning observability from a reactive debugging tool into a proactive maintenance system.
Universal Integration Ecosystem
With automated instrumentation for OpenAI, Anthropic, Google Gemini, Mistral, LangChain, LangGraph, Claude Agent SDK, OpenAI Agents SDK, Mastra, Vercel AI SDK, AutoGen, LlamaIndex, CrewAI, Agno, DSPy, and Google ADK—TraceRoot likely works with your stack today with zero configuration changes.
Real-World Use Cases Where TraceRoot Shines
The Runaway Tool-Calling Agent
Your customer support agent is supposed to check order status, process returns, and escalate complex issues. Instead, it's calling the "refund" tool 47 times for a single $5 purchase, burning through API credits and creating accounting nightmares. Traditional tools show you the tool calls; TraceRoot identifies the exact condition in your orchestration logic that failed to implement rate limiting, shows you the commit where the guardrail was accidentally removed, and suggests the fix.
The Hallucinating RAG Pipeline
Your documentation assistant is confidently citing non-existent API endpoints and deprecated parameters. Users are building broken integrations based on its answers. Traces show the retrieval succeeded, but how do you debug what the LLM did with that context? TraceRoot's source code sandbox reveals that your prompt template has a formatting bug causing context to be misaligned with the question, and correlates this with a PR that refactored template handling three weeks ago.
The Multi-Agent Coordination Failure
Your research agent delegates to sub-agents for web search, synthesis, and fact-checking. Sometimes tasks complete successfully. Sometimes they loop forever. Sometimes the synthesis agent receives garbled input from the search agent. Debugging distributed agent systems is exponentially harder than single-agent debugging. TraceRoot captures the full distributed trace with agent handoff semantics, identifies the message serialization issue in your inter-agent protocol, and shows which dependency upgrade introduced the breaking change.
The Production Regression You Can't Reproduce
Everything works in staging. Production fails intermittently with no clear pattern. Your agent's behavior seems to change based on time of day, user location, or moon phase. TraceRoot's intelligent trace filtering surfaces the anomalous pattern: failures correlate with a specific tool version that only gets called for EU users due to a routing rule you forgot existed. The GitHub correlation immediately shows the PR that added GDPR-compliant routing and accidentally pinned an outdated tool dependency.
Step-by-Step Installation & Setup Guide
TraceRoot offers multiple deployment modes depending on your needs—from instant cloud access to full production Kubernetes deployments.
Option 1: TraceRoot Cloud (Fastest Start)
For immediate experimentation without infrastructure setup:
- Navigate to app.traceroot.ai
- Sign up for an account (no credit card required)
- Receive ample storage and LLM tokens for testing
- Follow the in-app integration guide for your framework
This is ideal for evaluation and small projects. Your traces are hosted in TraceRoot's managed infrastructure.
Option 2: Local Development Mode
For contributing to TraceRoot or developing with full control:
# Clone the repository
git clone https://github.com/traceroot-ai/traceroot.git
cd traceroot

# Start infrastructure in Docker↗ Bright Coding Blog, run app locally
make dev
The make dev command orchestrates Docker containers for dependencies (databases, message queues, etc.) while running the application server locally with hot reload. This gives you fast iteration for development work. See CONTRIBUTING.md for detailed contribution guidelines.
Option 3: Local Docker Production Mode
For testing the full stack↗ Bright Coding Blog locally before production deployment:
# Clone the repository
git clone https://github.com/traceroot-ai/traceroot.git
cd traceroot

# Run everything containerized
make prod
The make prod command builds and starts all services in Docker, giving you a complete local environment that mirrors production architecture.
Option 4: Production Kubernetes Deployment (Experimental)
For production-scale self-hosting on AWS↗ Bright Coding Blog:
# Navigate to deployment configurations
cd deploy/

# Review and customize Terraform variables
vim terraform.tfvars

# Initialize and apply infrastructure
terraform init
terraform plan
terraform apply

# Deploy with Helm
helm install traceroot ./helm-chart
This deploys TraceRoot on Kubernetes with Helm charts and Terraform-managed AWS infrastructure. Note that this is currently experimental—review configurations carefully and consider reaching out to the maintainers for production guidance.
REAL Code Examples from the Repository
TraceRoot's SDK design prioritizes minimal intrusion—you add a few lines of instrumentation and immediately capture rich traces. Here are the actual quickstart implementations from the repository, explained in detail.
Python↗ Bright Coding Blog SDK: Instrumenting an OpenAI-Powered Agent
import traceroot
from traceroot import Integration, observe
from openai import OpenAI

# Initialize TraceRoot with OpenAI integration
# This automatically instruments Chat Completions and Responses API calls
traceroot.initialize(integrations=[Integration.OPENAI])

# Standard OpenAI client—no wrapper needed, instrumentation is automatic
client = OpenAI()

# The @observe decorator captures the full execution context:
# - Entry/exit timestamps
# - Input parameters and return values
# - Nested LLM calls and tool executions
# - Exception details if failures occur
@observe(name="my_agent", type="agent")
def my_agent(query: str) -> str:
    # This chat completion is automatically traced with full metadata:
    # model name, token usage, latency, prompt/response content
    response = client.chat.completions.create(
        model="gpt-4o",
        messages=[{"role": "user", "content": query}],
    )
    return response.choices[0].message.content

if __name__ == "__main__":
    # Execute the agent—trace is automatically sent to TraceRoot
    my_agent("What's the weather in SF?")
What's happening here? The traceroot.initialize() call installs OpenTelemetry instrumentation hooks into the OpenAI SDK. When client.chat.completions.create() executes, TraceRoot captures the full request/response cycle without you modifying any OpenAI client code. The @observe decorator creates a parent span for your agent function, so all nested operations appear in a hierarchical trace. The type="agent" annotation tells TraceRoot this is an agent entry point, enabling specialized analysis and filtering.
TypeScript SDK: Async Agent with Graceful Shutdown
import OpenAI from 'openai';
import { TraceRoot, observe } from '@traceroot-ai/traceroot';

// Initialize with explicit module instrumentation
// The instrumentModules pattern gives fine-grained control over what gets traced
TraceRoot.initialize({ instrumentModules: { openAI: OpenAI } });
const openai = new OpenAI();

// observe() wraps your function with trace context propagation
// The returned function has identical signature—full type safety preserved
const myAgent = observe({ name: 'my_agent', type: 'agent' }, async (query: string) => {
  // Automatic tracing of streaming and non-streaming completions
  const response = await openai.chat.completions.create({
    model: 'gpt-4o',
    messages: [{ role: 'user', content: query }],
  });
  return response.choices[0].message.content;
});

async function main() {
  try {
    // Execute agent—trace captures async context across event loop boundaries
    await myAgent("What's the weather in SF?");
  } finally {
    // Ensure all pending traces are flushed before process exit
    // Critical for serverless environments where abrupt termination is common
    await TraceRoot.shutdown();
  }
}

main().catch(console.error);
Critical implementation detail: The TraceRoot.shutdown() call in the finally block is essential for production. OpenTelemetry traces are batched and sent asynchronously—without graceful shutdown, you lose traces from short-lived processes like serverless functions. The instrumentModules pattern (vs. the Python Integration enum) reflects TypeScript's more explicit module system and gives you surgical control over instrumentation scope.
Installation Commands
# Python—one line, includes OpenAI for the quickstart
pip install traceroot openai

# TypeScript/Node.js
npm install @traceroot-ai/traceroot openai
These minimal dependencies demonstrate TraceRoot's design philosophy: instrumentation should never complicate your dependency tree. The core SDK is lightweight; heavy integrations are optional and lazy-loaded.
Advanced Usage & Best Practices
Selective Instrumentation for Cost Control
Not every LLM call needs tracing. In high-volume applications, instrument only critical paths:
# Conditional initialization based on environment
traceroot.initialize(
    integrations=[Integration.OPENAI],
    sampling_rate=0.1,  # Trace 10% of requests in high-volume paths
    filter_patterns=["*/critical/*"]  # Always trace specific routes
)
Custom Span Attributes for Business Context
Enrich traces with domain-specific metadata for better filtering:
@observe(name="support_agent", type="agent")
def support_agent(query: str, user_tier: str):
    traceroot.set_attribute("user.tier", user_tier)
    traceroot.set_attribute("query.category", classify_query(query))
    # ... agent logic
BYOK Configuration for Security-Conscious Teams
When your code analysis runs on sensitive proprietary code, control the model endpoint:
traceroot.initialize(
    debugging_model="anthropic/claude-sonnet-4-20250514",
    api_base="https://your-vpc-endpoint.anthropic.com",
    api_key=os.environ["ANTHROPIC_VPC_KEY"]
)
Integration with Existing Observability Stacks
Since TraceRoot emits standard OpenTelemetry, export to your existing backend:
traceroot.initialize(
    integrations=[Integration.OPENAI],
    otlp_endpoint="https://your-jaeger-instance:4317"
)
Comparison with Alternatives
| Capability | TraceRoot | LangSmith | Langfuse | Weights & Biases | Traditional APM (Datadog, New Relic) |
|---|---|---|---|---|---|
| Open Source | ✅ Full platform | ❌ Proprietary | ✅ Core open | ❌ Proprietary | ❌ Proprietary |
| Agent-Specific Tracing | ✅ Purpose-built | ✅ LangChain-focused | ✅ General LLM | ✅ ML-focused | ❌ Generic HTTP/RPC |
| Source Code Debugging | ✅ Sandboxed execution | ❌ Trace only | ❌ Trace only | ❌ No | ❌ No |
| GitHub History Correlation | ✅ Commits, PRs, issues | ❌ No | ❌ No | ❌ No | ❌ No |
| Self-Healing (Auto PRs) | ✅ Experimental | ❌ No | ❌ No | ❌ No | ❌ No |
| BYOK Model Support | ✅ Any provider | ⚠️ Limited | ⚠️ Limited | ❌ No | N/A |
| Framework Coverage | ✅ 12+ frameworks | ⚠️ LangChain ecosystem | ⚠️ Major frameworks | ❌ Requires custom | ❌ None |
| Vendor Lock-in Risk | ✅ None (self-host) | ⚠️ Cloud dependency | ✅ Self-hostable | ⚠️ Cloud dependency | ❌ High |
The decisive difference: Other tools show you that something failed. TraceRoot shows you exactly where in your code, when the bug was introduced, and can propose a fix. This transforms observability from diagnostic to curative.
FAQ
Is TraceRoot really free for production use?
Yes. The core platform is Apache 2.0 licensed. Enterprise features (advanced RBAC, SSO, audit logging) are under a separate license. You can self-host the full observability and debugging stack without cost.
How does source code debugging maintain security?
TraceRoot spins up isolated sandboxes for code analysis. Your source code never leaves your infrastructure unless you explicitly configure cloud debugging. BYOK ensures your API keys for model providers stay under your control.
Can I use TraceRoot with my existing OpenTelemetry setup?
Absolutely. TraceRoot's SDK is a standard OpenTelemetry instrumentation library. You can export traces to Jaeger, Zipkin, or any OTLP-compatible backend alongside TraceRoot's specialized analysis.
What model providers work with the debugging AI?
Virtually all major providers: OpenAI, Anthropic, Google Gemini, xAI, DeepSeek, OpenRouter, Kimi, GLM, and more. The BYOK architecture means new providers work immediately with standard API compatibility.
How mature is the self-healing PR generation?
This capability is experimental and improving rapidly. We recommend reviewing all generated PRs carefully—treat it as an accelerated starting point for fixes, not unsupervised automation.
Does TraceRoot work with non-Python/TypeScript agents?
The SDK currently supports Python and TypeScript/JavaScript↗ Bright Coding Blog. For other languages, you can use the OpenTelemetry collector with manual instrumentation—full SDK support for Go and Rust is on the roadmap.
What's the performance overhead of instrumentation?
Typically <1% latency impact for standard tracing. The debugging sandbox runs asynchronously and doesn't block request processing. Sampling controls let you reduce overhead further in high-throughput scenarios.
Conclusion
AI agents are the most complex software systems we've ever built—and we're debugging them with tools from a simpler era. That ends now.
TraceRoot represents a fundamental shift: from observing agent behavior to understanding and fixing it. The combination of intelligent trace filtering, source-code-aware debugging, and self-healing capabilities doesn't just save hours of debugging time—it makes previously impossible debugging scenarios routine.
As a Y Combinator S25 company with fully open-source foundations, TraceRoot is betting that the future of agent infrastructure is transparent, extensible, and developer-controlled. No black boxes. No vendor lock-in. No more debugging blind.
Your next step is simple: clone the repository, run make dev, and instrument your first agent in under five minutes. Or skip straight to TraceRoot Cloud for instant access. Either way, you'll never debug AI agents the same way again.
The agents are getting smarter. Your debugging tools should too.
Star the repo, join the Discord, and follow @TraceRootAI for updates. The future of agent observability is being built in the open—and you're invited to shape it.
